Eatable
1 Introduction
As college students in a major city, we often enjoy eating at restaurants as a form of social outing, but, given the budget of a college student, our first thoughts after a meal are often, “Was that food really worth that price?” or “Was that food a total bargain?” Given the opportunity to design a project of our own choosing, we set out to answer the question of, “is a meal a scam or a steal?” In the development of our model we discovered that we had also inadvertently answered a second question. We realized that our model could not only tell the consumer whether they are overspending or getting a great deal on a meal, but also tell a restauranteur whether they are underpricing their dishes and losing revenue, or overpricing dishes and losing customers, and therefore revenue.
While no exact prior model exists, we based our experiment on the design of two previous models published in journal articles. The first model attempted to guess the prices of secondhand clothing based on image input that was often non-standardized (Han et al. 2019). We were tasked with learning how to account for photos taken by the average person instead of professionally staged with lighting and a backdrop, which was also addressed by the first model. The second model attempted to classify types of food from a photo, a process we believed could help us in predicting food price based on image input (Nordin, Xin, and Aziz 2019). The model was limited as it only was able to identify different types of rice (a task too specific for our end goal), but the architecture enabled us to identify subtle differences between similar foods. Although neither of these models were identical to our proposed model, they provided unique insights about individual components that made up our project. With the help of previous literature, we gained a solid foundation for creating a unique model to solve a novel problem.
2 Methods
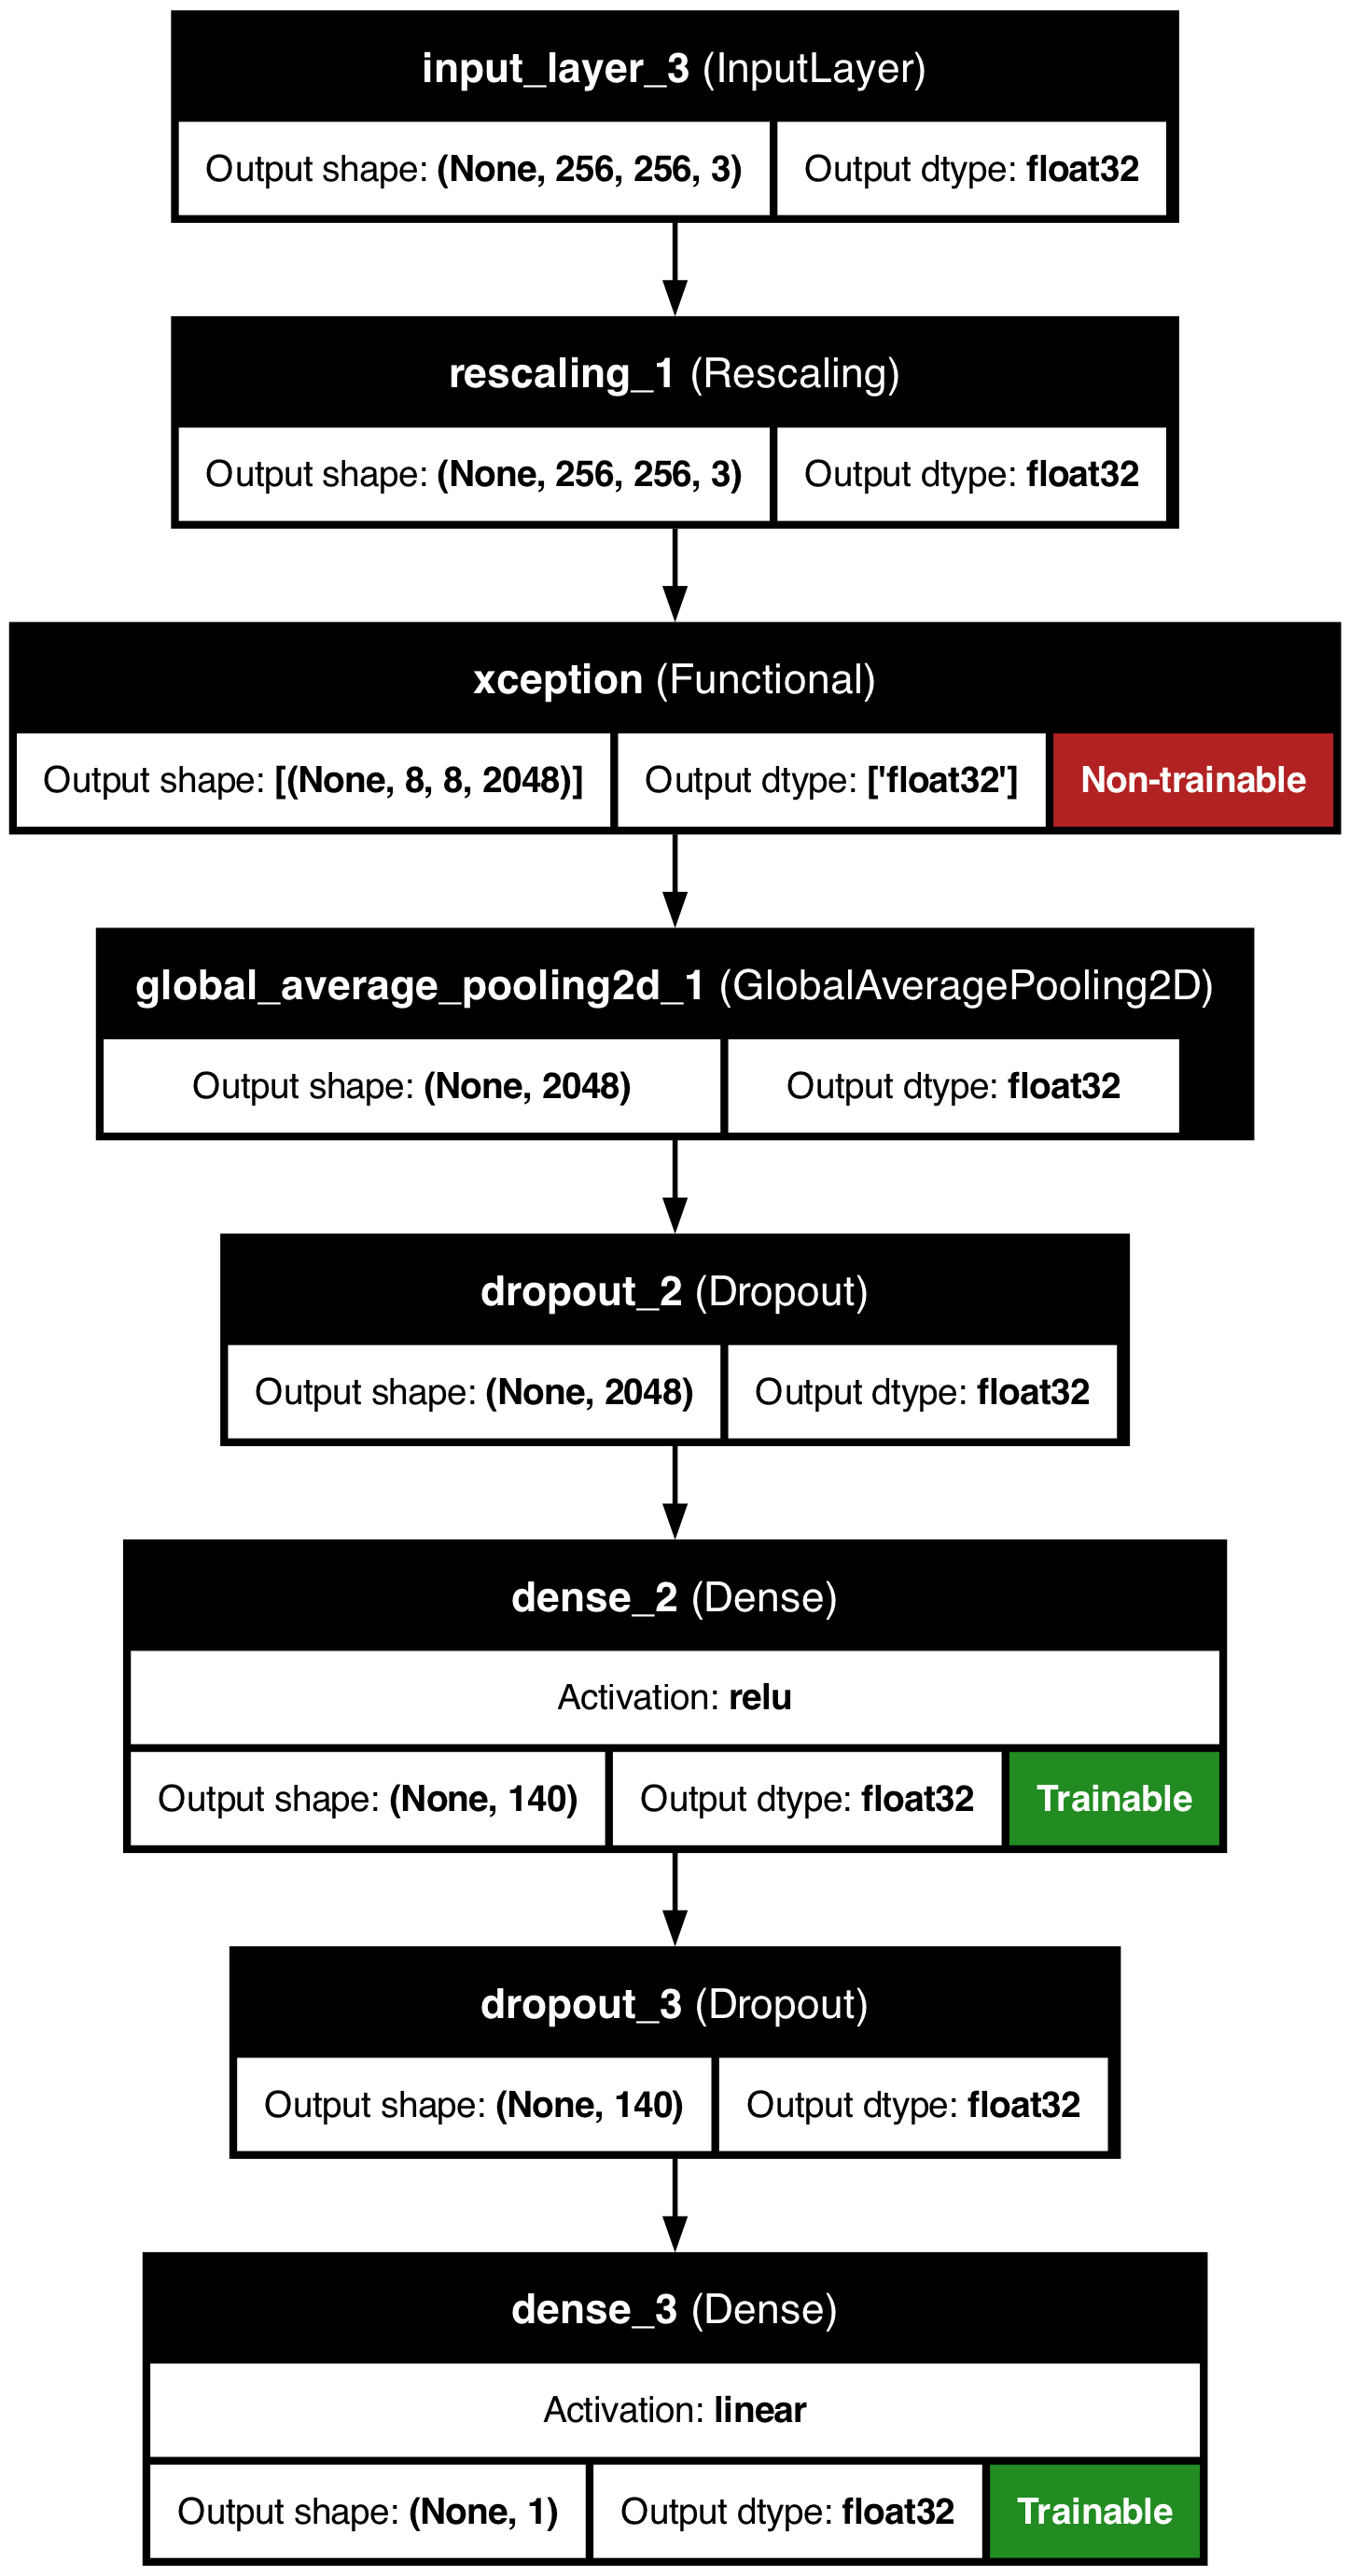
Our experiment attempts to predict the price of meals based on an input image. We began by collecting data to train our model on, and sourced meal images from restaurants on Toast. After scraping and collecting sufficient data, we constructed a Keras Xception model including weights trained on Imagenet data. With training, testing, and validation sets of data collected and established, we could begin to modify layers in the model to determine the most helpful iteration of the model. We first created a model that classified images into price “buckets,” but realized that grouping the images into $5-incremented buckets lost valuable price data. We shifted to a regression model that had better accuracy than bucketed data. Our final model includes Global Average Pooling 2D, dense ReLU-activated, and dense linear layers, as well as several hyperparameters defined by hyperparameter optimization. We measured the success of the model using mean-squared error as a loss function, and then calculated the number of correct predictions at increasing margins (from $1 to $20).
2.1 Data
In the early stages of our project, we realized there did not exist a large enough data set of food images and prices that was freely available to us. We decided to use Toast, a cloud-based restaurant management software that works as the internal and external point of sale for many restaurants, as our training data source. Our decision to use Toast as the software compared to other online food ordering applications like Grubhub or Uber Eats, came from the fact that Toast reflects the actual prices of the dishes compared to the price gouging that you see from the delivery services mentioned. To store Toast’s information in an easily accessible and understandable way, we utilized a SQLite database with two tables: one for the restaurants, and the other for the restaurant items.
The first assumption we made was that the training data would only use D.C. restaurants. The price of a meal can vary between cities, and with a limited amount of time to scrape a very large amount of data, we resolved to focus on D.C. restaurants for the scope of this project.
To actually scrape the data, we used Playwright, a Microsoft developed open-source library for browser testing and web scraping. By running Playwright on our personal computers, a headless Google Chrome window was opened where the restaurants were scraped and inserted into our SQLite Restaurants table. Once all the desired restaurants were stored, we scraped the menus of those restaurants, and inserted the prices, dish names, and image paths into our Dish table. (See Figure 1 for full SQL diagram.)
The next step was to store the images of the food in such a way that our model would accept as input. We downloaded the food images into a local directory by extracting Toast’s image path from our database, replacing the internet-facing path with the local path. With this separation of actual picture files, we created a direct way for our model to access the pictures locally instead of including image downloading in the actual model.
To clean up our data we made the assumption of focusing solely on entrees for our model, and eliminating side dishes and drinks. Because of this, we limited training prices to be within the range of $10–$50 dishes. This also eliminated apparel items sold by some restaurants such as hats and t-shirts. A few prices that we collected also included characters such as “+”, meaning that a dish starts at a price and can increase from there. Those food items were removed from the test data set entirely.
2.2 Neural Network
We used the Keras Xception model with weights trained on Imagenet data, and modified the model to add our own layers. We added a Global Average Pooling 2D layer, then a dropout layer. After the initial dropout, we included a dense ReLU activated layer, and another dropout. We then used hyperparameter search to identify the optimal hyperparameters for the model. Our hyperparameter search returned a few useful specifications, including a learning rate of 0.01 and 15 epochs. We also used Hyperband to minimize loss. With a complete Xception model and hyperparameters, we could then begin to train the model.
2.3 Measuring Success
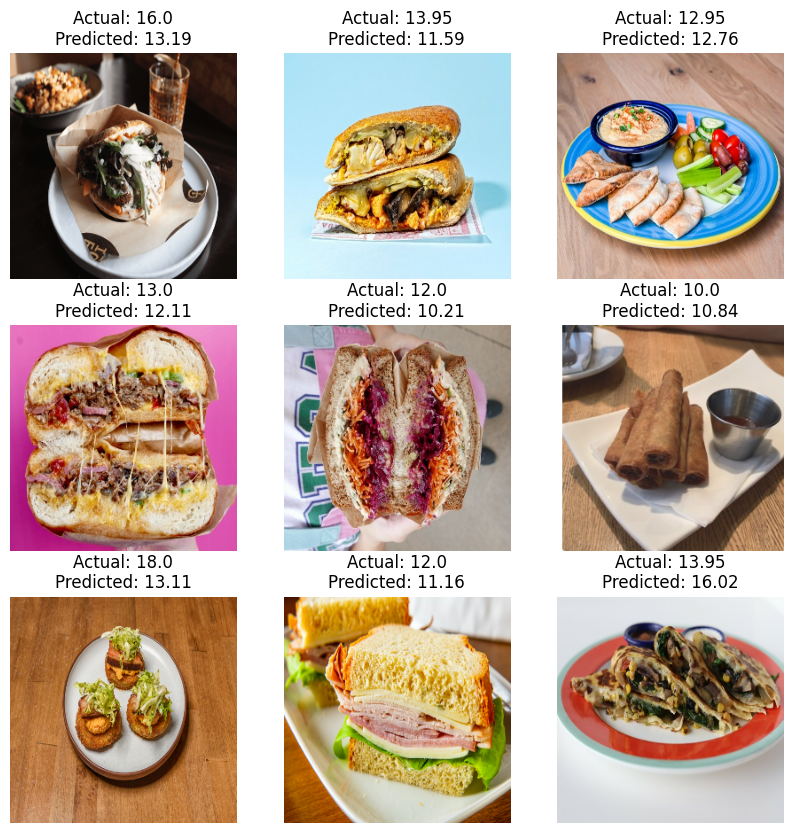
In our regression model, we quantified loss using mean squared error. Once the hyperparameters were selected and the model was trained, we evaluated the model again using mean squared error on test data as a simple measure of success. As part of this, we also inspected a small sample of the test data and the model’s prediction (Figure 3).
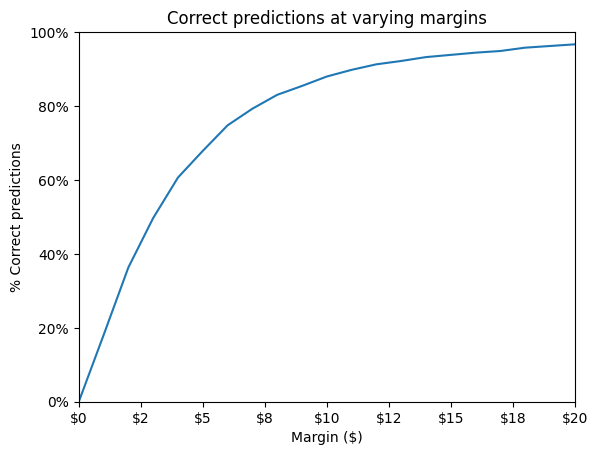
To get a better measure of the success and accuracy of our model, we predicted the prices of all of our test data and then calculated the number of correct predictions at increasing margins (from $1 to $20).
3 Results
Our model performed very well considering the limited dataset we had. 18% of test data predictions were within $1.00 of the actual price; within $3.00, 50% of predictions were accurate; and 83% of predictions were within $8.00 of actual price. Considering price variations on menus at different times of day (lunch vs. dinner menus), at different locations, varying image quality and type, and restaurant service charges and fees, we decided that being within $3–5 of actual price is decently accurate (see Table 1, Figure 4 for full results).
| Margin | % Accurate |
|---|---|
| $1.00 | 18.02% |
| $3.00 | 49.70% |
| $2.00 | 36.34% |
| $4.00 | 60.66% |
| $5.00 | 67.87% |
| $6.00 | 74.77% |
| $7.00 | 79.28% |
| $8.00 | 83.03% |
| $9.00 | 85.44% |
| $10.00 | 87.99% |
| $11.00 | 89.79% |
| $12.00 | 91.29% |
| $13.00 | 92.19% |
| $14.00 | 93.24% |
| $15.00 | 93.84% |
| $16.00 | 94.44% |
| $17.00 | 94.89% |
| $18.00 | 95.80% |
| $19.00 | 96.25% |
| $20.00 | 96.70% |
4 Future Work
During the building of our project we identified four core areas for improvement that were not critical to the performance of our model, but if given the time to implement, would likely increase our overall performance and application of our model.
During our examination of the collected data, we noticed a number of items that were not food: sodas, alcoholic beverages, restaurant merchandise, and cetera. We attempted to clean our data of these items by implementing a simple price filter (only including menu items between $10 and $50), but given the volume of data we collected, many non-food items were still included. If we feed the menu item names (and descriptions) to an LLM to classify and filter non-food menu items out from our input to the training of our model, we believe we could improve our accuracy. (We similarly could have included this type of filter prior to predicting an uploaded image as our web app will attempt to predict the price of any uploaded image, food or not.)
Secondly, we would love to have collected more data, especially data from cities outside of Washington, D.C., as prices differ around the country. Including the city in addition to the photo as input to the model may improve accuracy, especially outside of the DMV.
Third, we noticed that some menus changed prices depending on the type of day; the same item may be on a lunch and dinner menu but priced differently on both. Therefore we would have liked to gather data from the same restaurant multiple times during the day to get the full range of their prices and include that data in our model. Then, similarly to location, the user could input which meal they are eating along with their photo in order to get the most accurate price prediction.
Finally, we discovered some inconsistencies with price predictions on details hard to make out from images. For example, the model can’t tell if your burger is wagyu or regular beef, which has a big impact on the price. We would hope to train the model not just on the image but also its associated description or ingredients list from its menu, and for the user to optionally include a description of the meal in order to get the most accurate price estimate.


